Fixture Overload: Monitoring How Crowded Calendars Alter Performance Indicators Across Soccer Leagues and Racing Circuits
 Data from major European soccer competitions shows that teams playing three or more matches within a seven-day window experience measurable declines in key performance metrics such as distance covered at high intensity and pass completion rates under pressure. Researchers tracking these patterns note that fixture density often correlates with increased injury reports and reduced recovery windows, particularly during winter months when weather adds further strain on players. Observers in the field point out that these shifts become especially pronounced in leagues with expansive cup commitments layered on top of domestic and European schedules. Analysts examining similar dynamics in horse racing circuits have documented parallel effects, where horses entered in consecutive races separated by fewer than ten days display altered stride patterns and stamina indicators according to timing data from tracks in Australia and North America. Studies compiled by university sports science departments reveal that trainers adjust preparation routines when calendars tighten, yet measurable drops in finishing speeds still appear in post-race biometric readings. Those monitoring both codes find that cross-sport correlations emerge during periods when major soccer tournaments coincide with peak flat and jumps seasons.
League-Specific Patterns in Soccer
Figures released by domestic soccer federations across multiple continents indicate that mid-table clubs suffer the sharpest form erosion under fixture congestion because squad depth remains limited compared with title contenders. One dataset covering the 2025-26 campaign highlighted that sides contesting continental group stages alongside league fixtures posted win rates dropping by an average of 12 percent in the subsequent three-match block. Performance analysts note that set-piece conversion rates and counter-attack efficiency suffer first, while possession statistics hold steadier until fatigue accumulates over repeated cycles.
Coaches in leagues operating winter breaks report different recovery curves than those in year-round competitions, and data from South American federations shows that travel distances compound the issue when schedules compress. Teams crossing time zones between league and cup fixtures record higher rates of late-match concessions, according to GPS tracking aggregated by performance institutes. Patterns become clearer when statisticians isolate matches occurring within 72 hours of a previous outing, revealing consistent drops in expected goals created during those windows.
Adjustments Observed on the Turf
Racing form databases maintained by industry bodies in Europe and Asia log entries where horses face quick returns after long-distance travel or testing ground conditions. Records indicate that animals running on consecutive weekends exhibit reduced sectional times in the final furlong, particularly when surface changes occur between outings. Trainers respond by shortening work intervals or selecting lower-grade targets, yet aggregate results still reflect the cumulative load through lower strike rates in follow-up races.
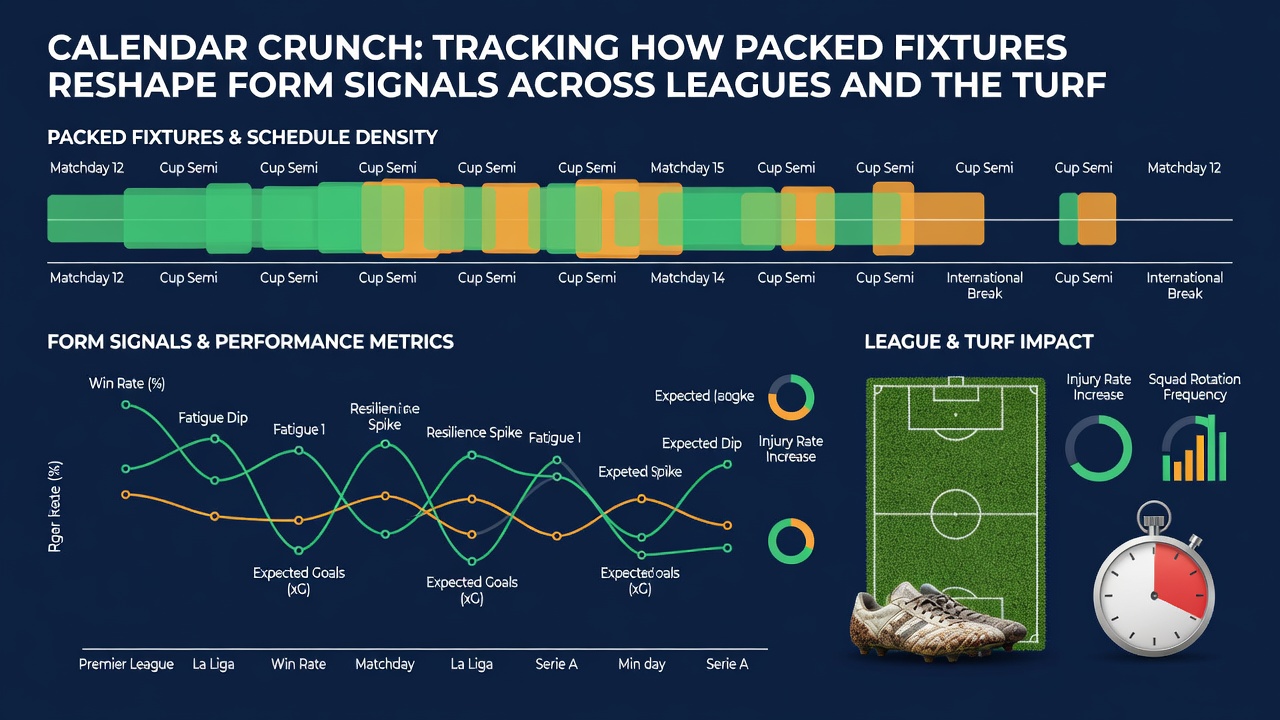
July 2026 brings an especially dense block of mid-summer fixtures across both codes, with several major racing festivals overlapping international soccer windows. Reports from track officials note that horses returning from overseas campaigns face tighter turnaround times, while soccer squads returning from continental tournaments encounter compressed pre-season calendars. Performance monitoring groups have begun integrating biometric wearables on racehorses with team tracking systems to quantify cross-code fatigue signals during these overlapping periods.
Data Integration Approaches
Specialist analytics platforms combine league fixture lists with racing program schedules to flag periods of elevated load across both domains. Algorithms flag instances where a soccer side plays midweek European ties followed by weekend league matches, then cross-reference against horse racing entries affected by the same calendar squeeze. Academic papers published by sports management faculties demonstrate that such integrated models improve identification of form outliers compared with isolated analysis of either sport.
Regulatory bodies in Canada and Australia have published guidelines encouraging federations to publish projected fixture calendars earlier, allowing participants and analysts to anticipate congestion windows. These documents cite evidence that advanced notice reduces last-minute schedule alterations that exacerbate recovery challenges. Observers tracking both soccer and racing note that markets adjust odds when such density indicators align with historical performance dips.
Conclusion
Comprehensive tracking of fixture density reveals consistent reshaping of form signals in both soccer leagues and racing circuits through measurable changes in recovery, intensity metrics, and output statistics. Data integration across codes continues to expand as organizations publish calendars further in advance and biometric tools capture cumulative load more precisely. Those studying these patterns continue to refine models that isolate congestion effects from other variables such as opponent quality and travel demands.