Performance Correlation Frameworks: Aligning Football Indicators and Horse Racing Figures for UK Composite Bets
Written by Greta Peters · Jul 28, 2026
Performance Correlation Frameworks: Aligning Football Indicators and Horse Racing Figures for UK Composite Bets
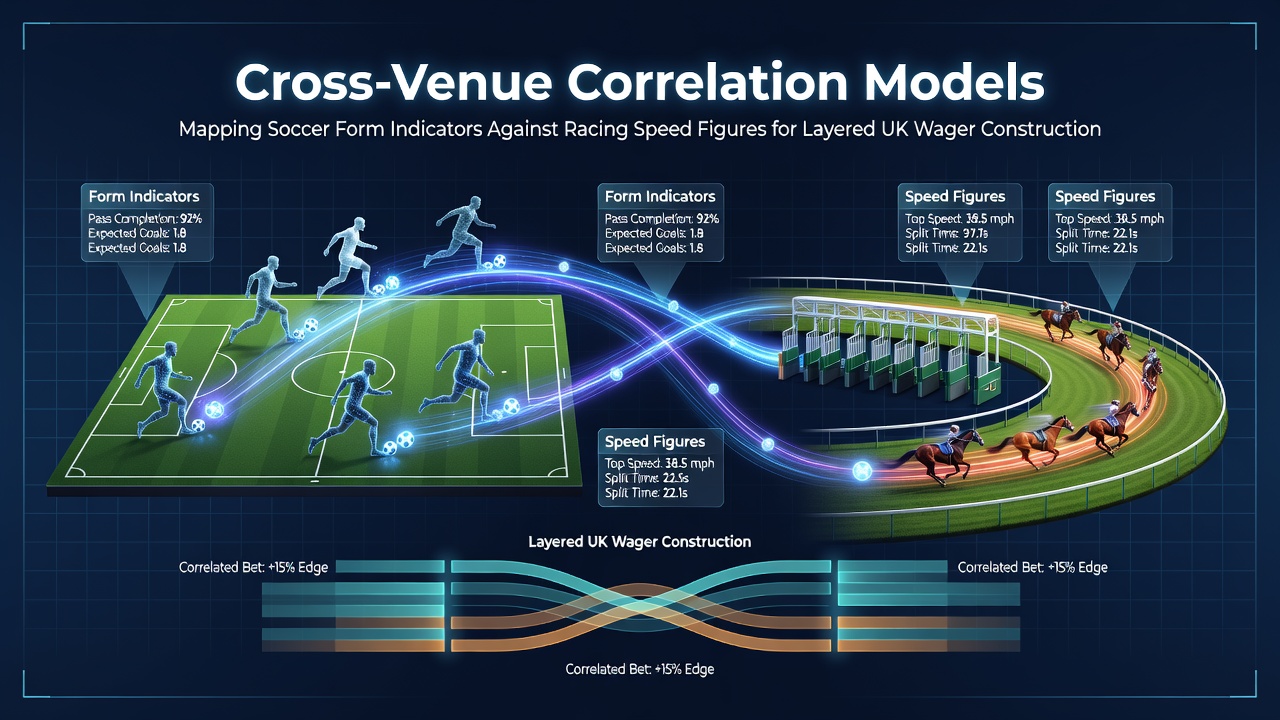
Analysts in the UK betting sector have developed correlation frameworks that map recent soccer team results and player metrics against horse racing speed figures drawn from official timing data, creating layered wager structures that combine multiple event types into single market positions. These models process datasets from Premier League matches alongside flat and jumps racing meetings, identifying statistical overlaps where strong defensive form in football coincides with improving sectional times on the track while factoring in variables such as ground conditions and fixture congestion.
Data Inputs and Model Construction
Researchers compile soccer indicators including expected goals, clean sheet rates, and possession-adjusted performance scores from domestic and European competitions, then align them with racing metrics such as speed ratings, going allowances, and last-race pace figures published by official timing providers. The process runs through regression analysis that weights recent form streaks against historical cross-sport patterns, producing probability outputs for simultaneous outcomes across venues. In July 2026 fresh datasets from the completed 2025-26 season and early summer racing cards became available, allowing recalibration of coefficients for variables like post-international break fatigue in soccer and early turf season speed biases on British tracks.
Software platforms used by professional syndicates ingest these inputs daily, generating layered ticket structures that might combine a soccer accumulator leg with a racing each-way component when correlation scores exceed preset thresholds. Observers note that such integration requires continuous updates because team news, non-runners, and weather shifts alter the underlying figures in real time.
Practical Application in Layered Markets
Bookmakers and exchange operators have recorded increased activity in multi-leg products that draw from both codes, with operators adjusting odds to reflect the statistical relationships captured in the models. One study released by an academic sports analytics group at a European university examined three seasons of Premier League and British jumps data, finding measurable alignment between mid-table teams posting high expected goals totals and certain trainers achieving above-average speed figures on similar ground conditions. Those findings have informed commercial tools that flag potential value when both indicators move in tandem.
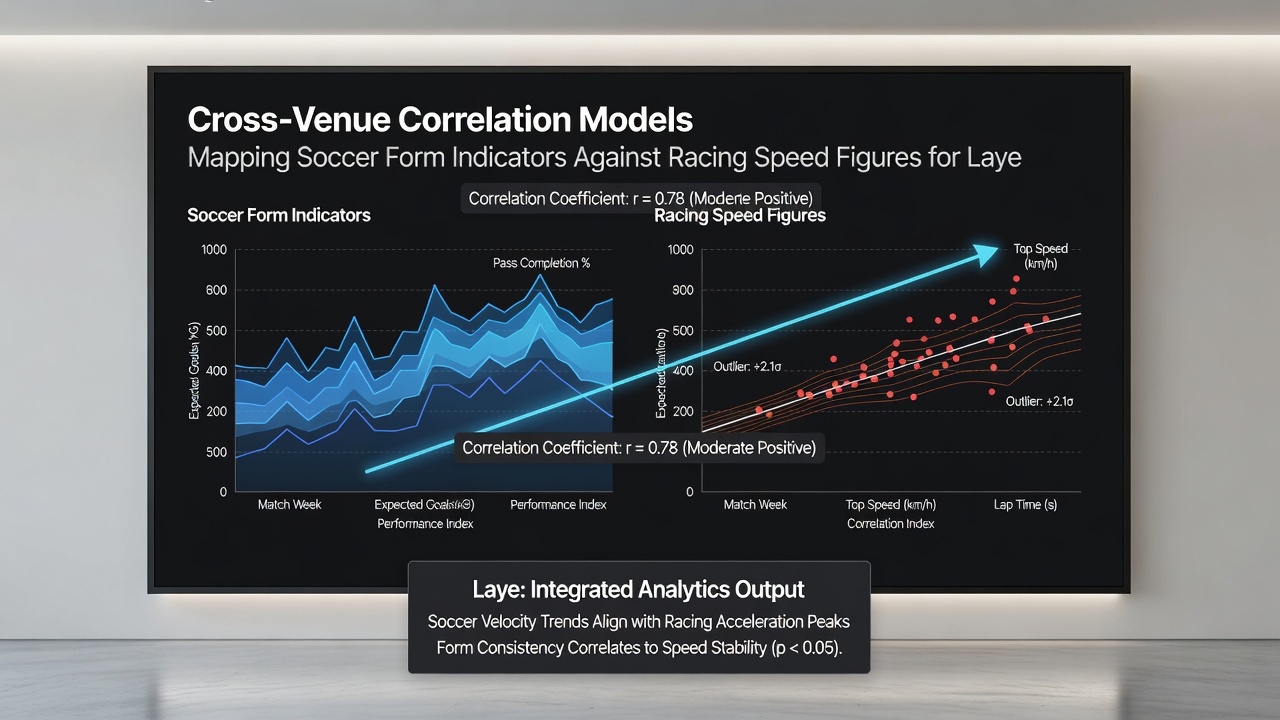
Practitioners construct positions by first selecting core soccer fixtures with stable form indicators, then overlaying racing selections whose speed profiles show historical covariance with those fixtures. The approach reduces isolated variance because a single poor result in one code can be offset by correlated strength in the other, provided the model has been back-tested against actual results from the past five years. Data from the Australian Institute of Sport analytics division has been referenced in industry discussions for its parallel work on multi-sport performance linkages, offering comparative benchmarks for UK operators refining their own systems.
Regulatory and Market Context
Industry associations such as the European Gaming and Betting Association have published guidance on responsible use of advanced analytics in product design, emphasizing transparency around how correlation models influence pricing and settlement. Figures released in mid-2026 showed steady growth in composite bet volumes across UK platforms, driven in part by improved data feeds that allow real-time adjustment of layered positions right up to off times. Operators maintain separate risk controls for these products because simultaneous events introduce liquidity considerations that single-code bets do not.
Traders monitor both live soccer statistics and in-running racing timings to recalibrate exposure, while compliance teams ensure that model outputs remain consistent with published terms. The frameworks continue to evolve as new seasons introduce fresh performance data, requiring periodic revalidation against actual payout records.
Conclusion
Cross-venue correlation models represent a technical layer added to existing UK betting infrastructure, linking soccer form indicators with racing speed figures through statistical mapping and layered construction techniques. Market participants apply these tools within established regulatory boundaries, relying on updated datasets and validated algorithms to manage positions across multiple event types. Continued refinement depends on access to accurate, timely performance records from both codes.