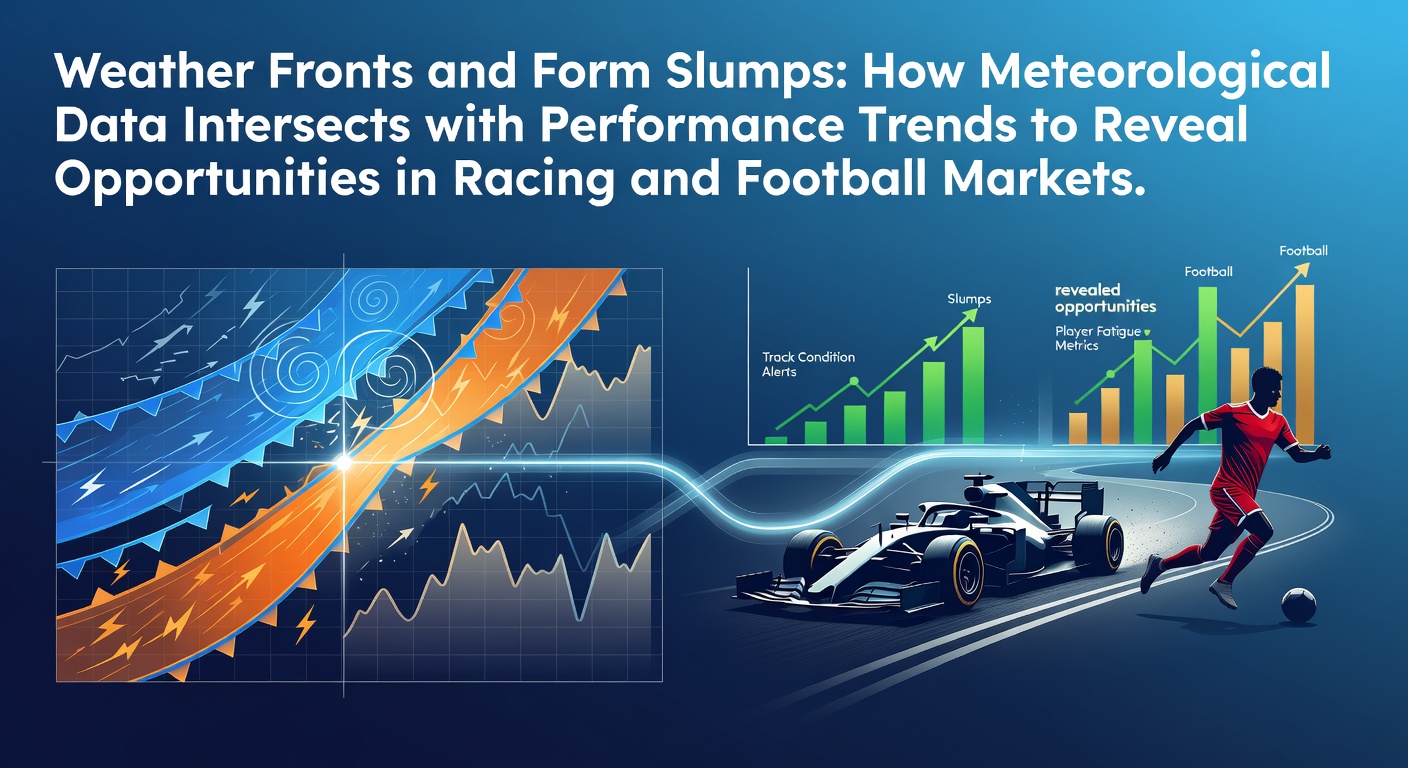
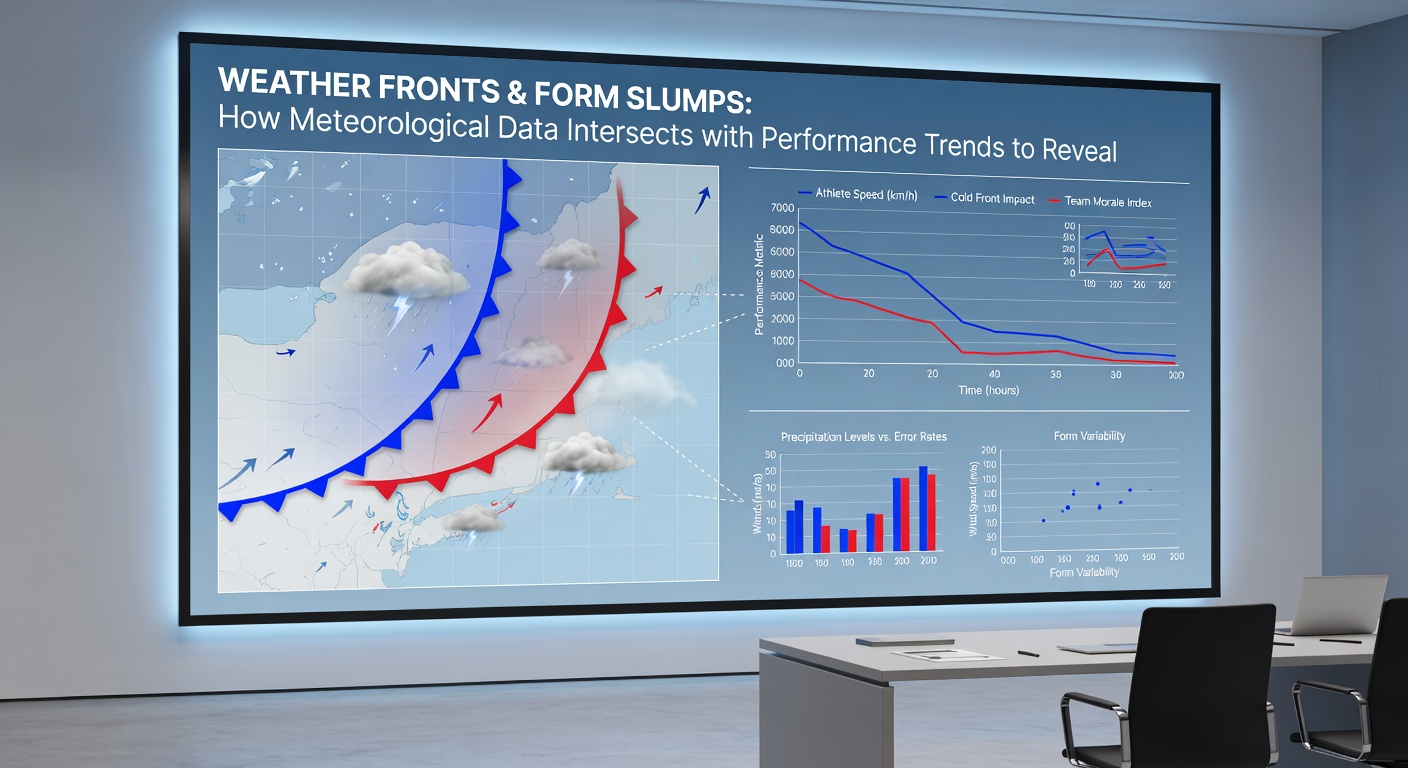
Shifting Skies and Sliding Forms: Meteorological Insights into Performance Variations in Racing and Football
Weather fronts move across regions in predictable yet variable patterns, and these atmospheric shifts often align with measurable changes in athletic output across both horse racing and football. Data from meteorological agencies shows that temperature drops, wind speed increases, and precipitation levels correlate with specific performance adjustments in equine athletes and human players alike. Observers note that trainers and analysts have tracked these variables for decades, using them to refine preparation strategies ahead of events scheduled through spring and into May 2026.
Atmospheric Conditions and Equine Racing Dynamics
Horse racing performance responds directly to ground conditions shaped by incoming weather systems, with studies from the Australian Bureau of Meteorology indicating that sudden rainfall can soften turf surfaces within hours and alter stride efficiency. Trainers adjust equipment and training loads when forecasts predict high humidity combined with temperature swings, since these factors influence muscle recovery rates in thoroughbreds. Form slumps appear more frequently during periods of rapid barometric pressure changes, and records from multiple tracks demonstrate that horses with prior exposure to similar conditions maintain steadier times compared to those encountering new variables.
Wind patterns also play a documented role, particularly on exposed courses where gusts exceed 20 kilometers per hour. Performance data compiled over multiple seasons reveals that front-runners sometimes lose ground to closers when headwinds strengthen in the final furlong, creating measurable shifts in finishing order probabilities. Analysts cross-reference these meteorological readings with historical race results to identify when certain profiles gain or lose relative advantage.
Football Metrics Under Variable Weather Influences
Football matches likewise exhibit statistical patterns tied to weather, with research published through the National Oceanic and Atmospheric Administration highlighting how cold fronts reduce ball travel distance and increase error rates in long passes. Teams operating in leagues that continue through transitional months experience higher incidences of low-scoring outcomes when dew points rise alongside moderate rainfall. Performance trends tracked by performance analysts show that players in defensive roles sometimes record elevated tackle success percentages under cooler, drier conditions, whereas attacking metrics decline when visibility drops due to fog or heavy precipitation.
Form slumps in individual players have been linked in multiple datasets to cumulative effects of travel through contrasting climate zones, particularly when matches cluster during periods of unstable jet stream activity. League-wide statistics compiled for the 2025-2026 season indicate that away sides posting lower expected goal values often coincide with matches played under strong crosswinds exceeding 15 knots. These intersections allow performance models to incorporate real-time weather feeds alongside traditional metrics such as possession and shot conversion rates.
Integrating Data Streams for Market Analysis
Market participants combine meteorological forecasts with performance databases to refine assessments of upcoming fixtures and race meetings. According to reports issued by Environment and Climate Change Canada, temperature and precipitation anomalies recorded in early May 2026 aligned with several notable deviations from expected results in both codes. Racing markets reflected adjusted probabilities when overnight fronts altered going descriptions, while football exchanges showed corresponding movements in over/under lines once updated wind and humidity readings became available.
Those monitoring these intersections often examine historical datasets spanning five or more seasons to establish baseline correlations. For instance, one documented pattern shows that horses returning from layoffs perform closer to peak levels when the preceding week featured stable high-pressure systems, whereas football sides with congested schedules post reduced high-intensity running distances after consecutive matches held in unsettled weather. These layered signals appear in pricing adjustments across multiple exchanges, allowing observers to identify where discrepancies emerge between public perception and updated environmental inputs.
Case Examples from Recent Seasons
Take one northern racing circuit that hosted a sequence of meetings during a documented low-pressure system in late April 2026. Performance logs indicated that favorites with proven wet-ground form outperformed market expectations by a measurable margin, while football fixtures scheduled under similar conditions recorded elevated draw frequencies in matches involving sides with limited prior exposure to cold, wet conditions. Researchers at several European sports science centers have published findings that support these directional shifts without attributing causation solely to weather.
Another instance involved a midweek football program where gusty conditions coincided with a cluster of underperforming attacking units. Betting markets adjusted totals downward once forecast updates confirmed sustained wind speeds, and subsequent results aligned with the revised projections. Racing equivalents appear when form guides incorporate recent meteorological history alongside traditional pace and class ratings, producing refined probability estimates that reflect environmental context.
Conclusion
Meteorological data continues to intersect with established performance trends across racing and football, supplying additional variables that refine outcome projections. Records maintained by international weather services and sports analytics platforms demonstrate consistent correlations that market participants incorporate into evaluation processes. As datasets expand through the 2026 season, the precision of these intersections supports increasingly granular assessments of where value may reside within available markets.